The Real Reason the Average Investor Trails the S&P 500
DALBAR and Morningstar data show U.S. fund investors regularly earn less than the funds they hold, often missing 15% of returns because of badly timed trades.
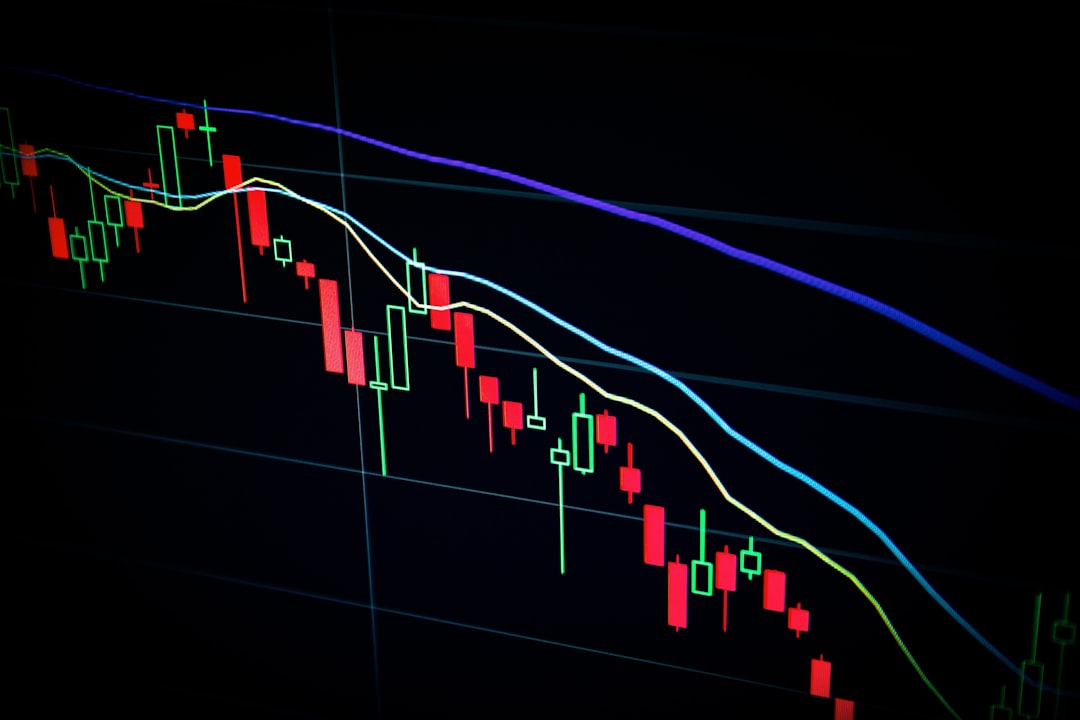
The S&P 500's long-run average annual return gets quoted constantly, but it describes what the index did — not what the people invested around it actually earned. DALBAR's Quantitative Analysis of Investor Behavior found that over the 20 years through the end of 2024, the average U.S. equity fund investor earned 9.24% annually, versus 10.35% for the S&P 500 itself. That gap shows up almost every year, and it isn't a fund performance problem — it's a timing problem.
A Guess-Right Ratio of Just 25%
DALBAR tracks something it calls the "Guess Right Ratio" — how often investors' overall buying and selling activity lines up with the direction the market actually moved next. In 2024, that ratio fell to 25%, tying a record low — meaning investors' collective inflows and outflows were on the wrong side of the market's next move three times out of four. In that same year, the average equity fund investor earned 16.54%, well behind the S&P 500's 25.05% return.
The pattern behind that number is familiar: buying more after a fund has already had a strong run (performance chasing) and selling more after a stretch of losses (panic selling), rather than the reverse. Neither behavior is irrational in the moment — a fund that's been rising feels safer, one that's been falling feels riskier — but both push the timing of purchases and sales in the direction that historically hurts returns rather than helps them.
Why a Decade of 8.2% Fund Returns Became 7.0% in Investors' Pockets
A fund's published return is time-weighted — it assumes a dollar sat invested for the entire period. What an actual investor earns is dollar-weighted, and it reflects exactly when money moved in and out. The difference between the two is what Morningstar's research calls the "gap."
Morningstar's Mind the Gap 2025 report, which tracks money flows into and out of U.S. mutual funds and ETFs, found that the average dollar invested earned 7.0% annually over the decade through December 2024, versus an aggregate 8.2% total return for those same funds — a gap of 1.2 percentage points a year, or roughly 15% of the total return investors could have captured. The gap was wider for ETFs specifically (negative 1.7 points annually) than for traditional open-end mutual funds (negative 1.2 points), and wider still for investors in actively managed funds (roughly 1.5 points) — in each case tracking the same underlying pattern of moving money at the wrong moments.
How large that gap runs in any given year depends on market volatility and how actively a given group of investors trades, so it isn't a fixed number that repeats identically every decade — but the direction of the effect has shown up consistently across the periods Morningstar and DALBAR have both studied.
The Problem Isn't the Fund. It's the Trade Around It.
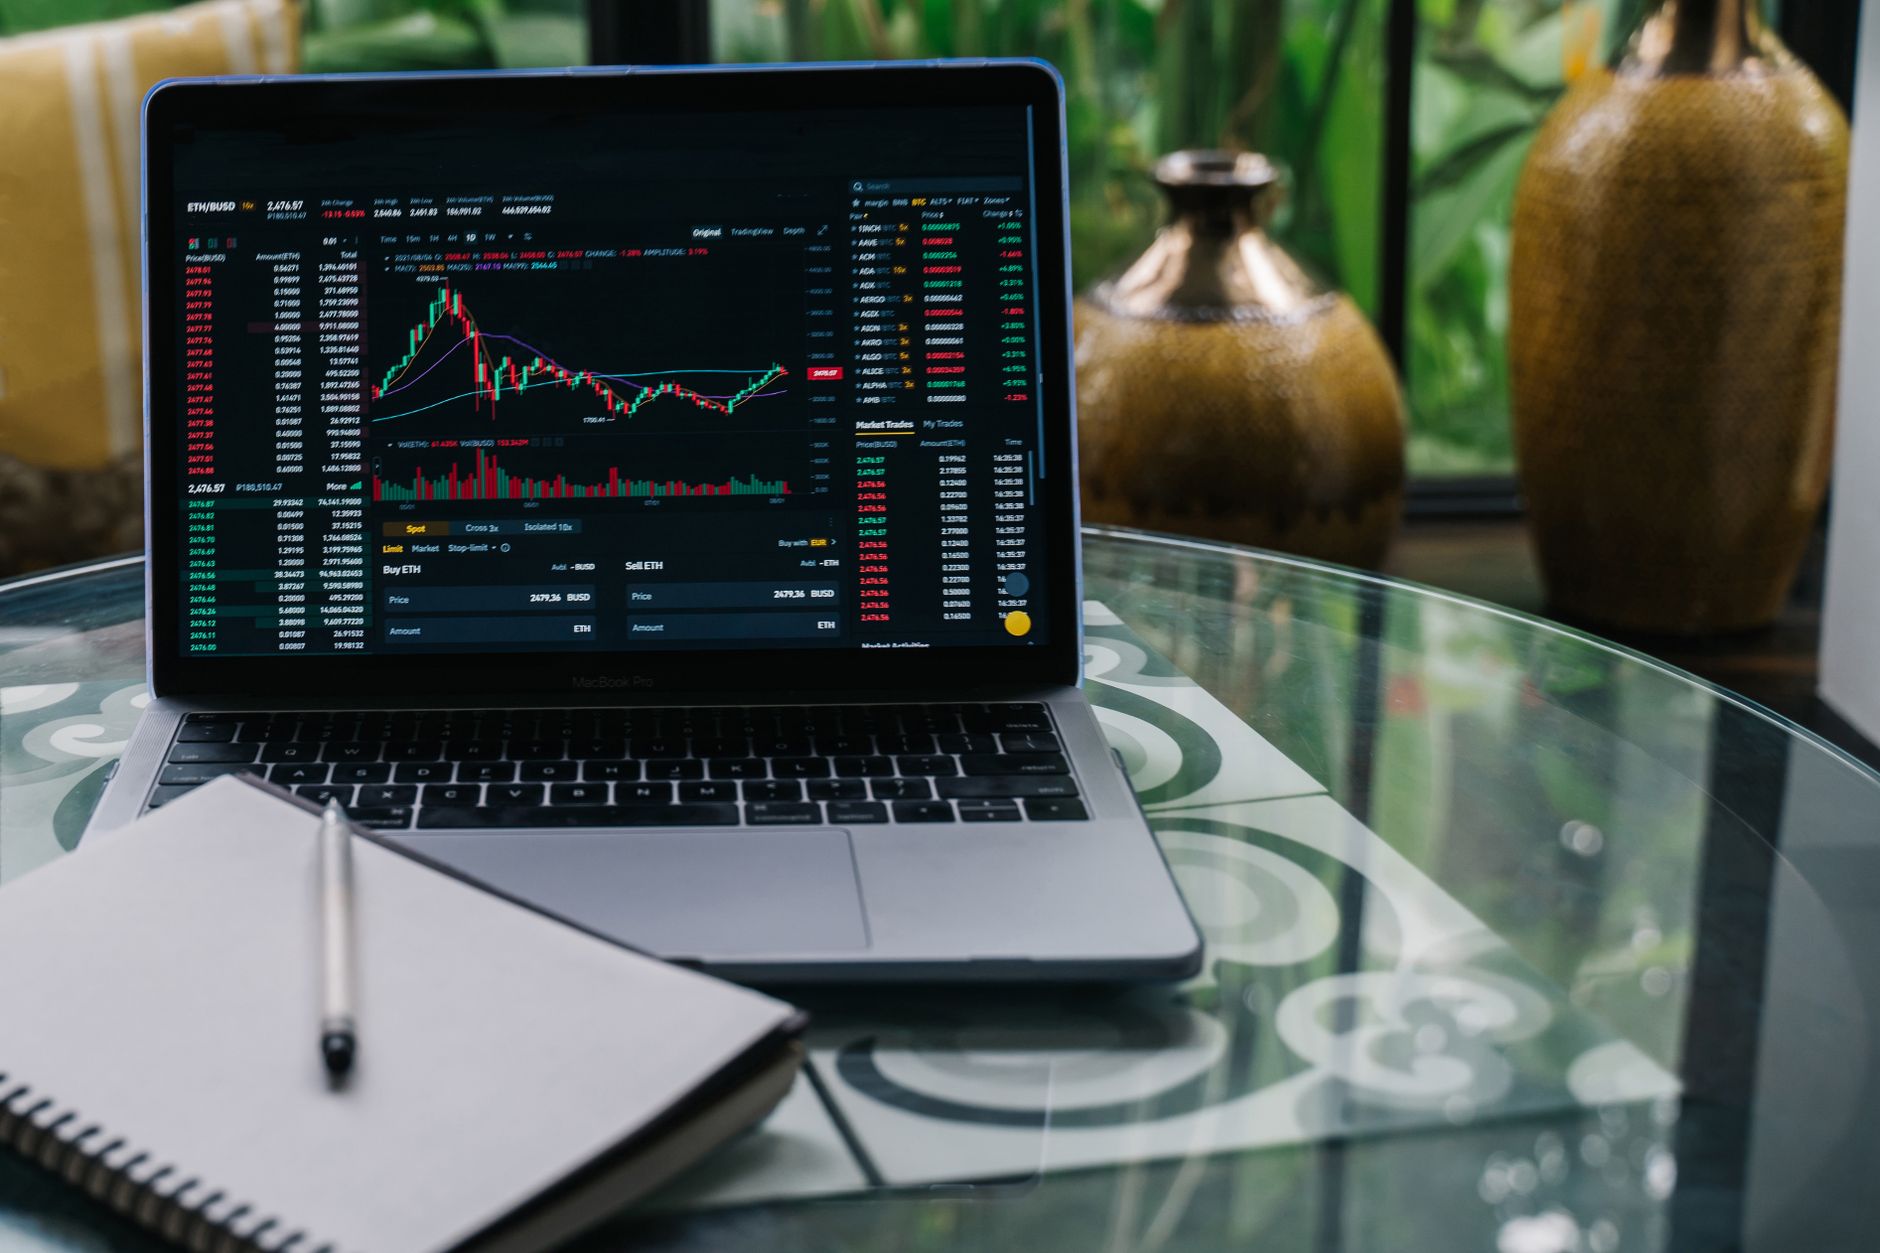
None of this is an argument that the fund did something wrong, or that a different fund would have closed the gap. The gap is a byproduct of transaction timing, which means the fix lives in how money moves in and out — not in fund selection.
- Automate contributions on a fixed schedule (a workplace retirement plan already does this by default) so that buying decisions aren't triggered by a headline about a recent rally or drop.
- Decide in advance what would actually change the plan — a change in timeline or goal, not a recent price move — so a selling decision isn't made in reaction to a bad week.
- Reduce how often the account gets checked. Frequent checking surfaces more short-term price swings, which research on loss aversion suggests makes reactive selling more likely.
- Broad, diversified fund categories, such as low-cost index fund categories, reduce the chance that one concentrated bet drives an outsized emotional reaction in either direction.
None of this guarantees any specific investor will close the entire 1.2-point historical gap in any given year — the size of that gap depends on market conditions and individual behavior going forward, not just on adopting a set of habits.
Frequently Asked Questions
Does this mean actively managed funds are the real problem? Not directly. Morningstar's data does show a wider gap for active-fund investors, but the underlying driver in both active and passive funds is the timing of investor cash flows, not the fund's strategy itself.
Is a 25% guess-right ratio unusual? It tied a record low in DALBAR's data, but ratios below 50% — meaning investors are more often wrong than right about near-term direction — have shown up repeatedly in prior years of the same study.
The real reframe here isn't "pick better funds" — it's that the return sitting in most investors' accounts is set less by what a fund did and more by when they moved money into and out of it. This is general information based on historical U.S. fund flow data, not a personalized recommendation, and it doesn't replace guidance from a licensed financial professional familiar with an individual's specific situation.
Related articles
 4 min read1 views
A Higher Expense Ratio Isn't Buying You Better Returns
A 1% fund expense ratio can quietly cost you hundreds of thousands of dollars over 30 years. See the real math on how fees compound and how to compare them.
 5 min read1 views
Last Year's Top Fund Category: The Real Reason It Rarely Repeats
Chasing last year's top-performing fund category is a common mistake. The mean-reversion mechanics behind why it rarely pays off, per SPIVA data.
 6 min read1 views